Briefing paper
Review of Energy Policy 2023
14 December 2023

Industrial sites will need to be largely decarbonised by 2050 to reach the UK’s net zero target. To explore the technologies and fuels required, we previously used the Net-Zero Industrial Pathways (N-ZIP) model to develop net zero pathways for UK industry under different assumptions and constraints. This showed that the key abatement measures include a combination of resource and energy efficiency, low carbon hydrogen, carbon capture and storage, and electrification. While this analysis applied constraints on hydrogen production and CO2 injection rates in different UK regions which therefore limit their availability to industrial sites, the electricity needed by sites was assumed to be always available (unconstrained). However, it is widely reported that new solar and wind sites may need to wait 10-15 years to be able to connect to the electricity network due to lack of capacity and there are stories of industrial sites also facing lengthy delays to upgrade their grid connections.
In this blog, we describe some preliminary analysis to explore the extent to which contraints on the distribution network may limit the ability of industrial sites to access the electricity they need to help decarbonise their processes. We examine this issue in two Distribution Network Operator (DNO) regions: Western Power Distribution (WPD, noting that this is currently named as National Grid Electricity Distribution (NGED)) and Electricity North West (ENWL) for which the necessary data is publicly available. We also only include industrial sites with known locations (i.e. only industrial point sources, see our previous work for more information). These point source sites account for less than half of the total expected electricity demand from all industrial sites in 2050.
We use the deep decarbonisaiton pathway results from the N-ZIP model to estimate the future electricity demand for each industrial site in the regions considered and compare it to the latest network demand headroom data reported by the two DNOs.. The expected additional electrical power for a site is calculated as the difference between the forecast electrical power in 2050 and the baseline electrical power in 2020 (which is considered to be currently available). Industrial sites are then assumed to obtain the additional electricity needed from the nearest electricity network substation that can provide the size of connection needed (i.e. sites with higher voltage requirements can only connect to a substation that can provide that voltage, which may not be the one that is closest). The nearest substation distance for all sites is estimated based on the Haversine distance (shortest distance between two points on the surface of a sphere).
For a significant number of industrial sites we find that the power demand estimates for 2050 are less than in 2020, due to the resource and energy efficiency assumptions in the N-ZIP model that lead to a reduction in the overall energy demand under the deep decarbonisation pathways. These sites, by default, are therefore assumed not to have any constraints on electricity demand. Furthermore, our approach does not take into account the expected additional electricity demand from other loads such as electric vehicles and heat pumps. For these reasons, our results can be interpreted as a “best case” scenario in terms of the ability of industry to access the increased electricity that it will need.
Based on the approach described above, we have created an interactive map for Great Britain showing the expected future electrical power for all industrial sites (point sources), the industrial sector to which they belong, and which DNO region they are in. The user can double click on the DNO region to highlight the sites and the power demand in that region. The map shows that the highest power demand is expected in industrial clusters and the demand from other industrial sites is distributed around the country, with particurlar concentrations in the north and north-west of England.
Focusing just on the WPD and ENWL DNO regions, the scale of the power demand needed for large industrial sites is shown in Figure 1.

Figure 1: Expected additional electrical power needed for UK industrial sites in WPD and ENWL DNO region in 2050
Figure 2 shows that, even under our “best case” assumptions, more than 20% of industrial sites in the ENWL and WPD regions are likely to be constrained in terms of electrical capacity (i.e. there is not enough demand headroom in the nearest appropriate substation to meet their expected additional electricity demand under the deep decarbonisation pathway).
The future additional electrical capacity required for those constrained sites is less than 2 MW in most cases, as shown in Figure 3. However, there are around 11 sites across both DNO regions for which the increase in electrical power will be more than 2 MW.
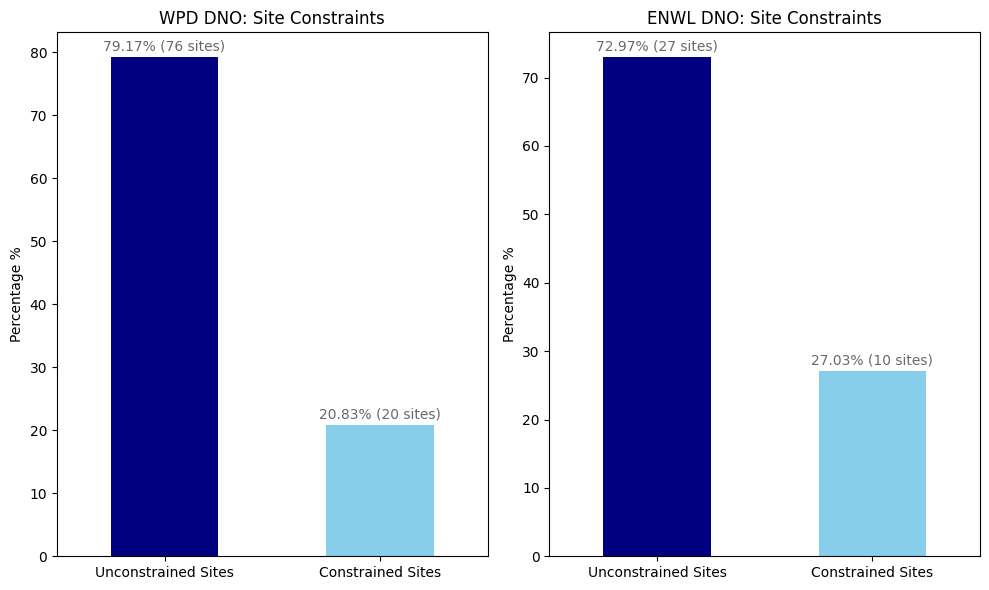
Figure 2: The number of constrained and unconstrained sites in terms of electrical network capacity in WPD and ENWL regions

Figure 3: The electrical capacity needed by constrained industrial sites in WPD and ENWL DNO regions
Figure 4 shows that the average capacity needed (calculated as the sum of total capacity needed by all sites in a given category divided by the total number of sites in that category) by a cluster-located site that is constrained is higher than for a dispersed site (those that are located on a radial distance of 25 km or more of the nearest UK industrial cluster points) in both DNO regions. However, Figure 5 shows that the number of dispersed industrial sites that are likely to be constrained in terms of electrical capacity is much greater than in the clusters.

Figure 4: The average capacity needed by constrained industrial site by location

Figure 5: Number of industrial constrained sites by location
Our preliminary analysis indicates that constraints on the distribution network could hamper the electrification of a significant number of industrial sites that will be needed for them to decarbonise in line with the UK’s net-zero target. Our current analysis has several simplifying assumptions, but these will tend to under-estimate the extent of such constraints.
We plan to build on this initial work to provide a UK wide analysis when the demand/generation headroom data from all DNOs are available. We will also explore alternative assumptions about the extent of future resource and energy efficiency improvements that affect the expected power demand for UK industrial sites, as well as review the available evidence that would allow us to include electricity use by non-point source industrial sites.
Through this blog, we hope to highlight what we consider to be an important and under-researched area. We therefore welcome comments on our approach and findings and are open to collaborate with interested partners to develop our analysis further. In particular, we would be interested to hear from researchers with access to geospatial data for the expected increases in electricity demand as a result of the decarbonisation efforts in other sectors such as transport and households.