Journal article
Decarbonisation Strategies in Industry: Going beyond clusters
03 May 2023

The manufacturing industry produces emissions in two main ways: (1) burning/using fossil fuels such as burning coke in steel furnaces and (2) releasing emissions as a co-product in the manufacturing activity as in cement making (known as process emissions). Industrial locations that produce these emissions are called point source sites. Their emissions data are available from regulatory regimes and national or local authorities. Point source emissions data in the UK are available from the National Atmospheric Emissions Inventory (NAEI).
In this blog, we analyse the latest 2020 NAEI point source emission data for the UK manufacturing industry to explore sectoral and regional emissions. We also compare it to the 2017 NAEI point source data that formed the basis of modelling the industrial sector in the UK’s government industrial decarbonisation strategy.
The NAEI data include sites that do not generally fall within the definition of manufacturing industry. Therefore, we filtered and categorised the latest 2020 NAEI data so that it can be used in models of industrial emissions to allow an up-to-date analysis. The data set includes site emissions for the main manufacturing sectors: iron and steel, refining, chemicals, cement, food and drink, paper, glass, ceramics, lime, other non-ferrous metals, and other industry.
Our harmonised NAEI 2020 data for the UK manufacturing industry can be accessed from here.
When building a model to represent the industrial sector, this baseline emissions data can be used differently. Some models distribute this emissions data to industrial processes without the need to establish an energy/commodity flow. This way, the baseline emissions data are correct, but energy use is not or do not correspond to this data.
Other models start from establishing an energy/commodity flow for industrial processes. However, when multiplying energy use by the emission factors, the resultant emissions data in the model may not correspond to the (actual) reported data.
If an accurate energy flow representation of industrial processes is possible, the modelling emissions can in some cases correspond to the reported emissions. For instance, the energy flow for a Combined Heat and Power (CHP) plant in the iron and steel sector suggests it is responsible for nearly 40% of the total emissions of a steel plant according to a study published in 2013. This emission percentage is found to be nearly the same for the CHP plant (part of UK steel sites) in the NAEI 2020 data.
The total point sources emissions for the UK manufacturing industry are 48.35 MtCO2 in 2020 compared to 54.2 MtCO2 in 2017 for the sectors listed above. These emissions are distributed as follows: 67%, 21%, 11%, and 1% in England, Wales, Scotland and Northern Ireland respectively as shown in Figure 1.

Figure 1 Total point source emissions for the UK manufacturing industry by region in 2020.
Figure 2 shows the location of industrial sites by sector and emissions size. It reveals that industry is distributed widely across the country, but most emissions are from the middle and the north of England. More than 50% of emissions come from very large iron and steel, refining and chemicals sites, which are in or near industrial clusters.
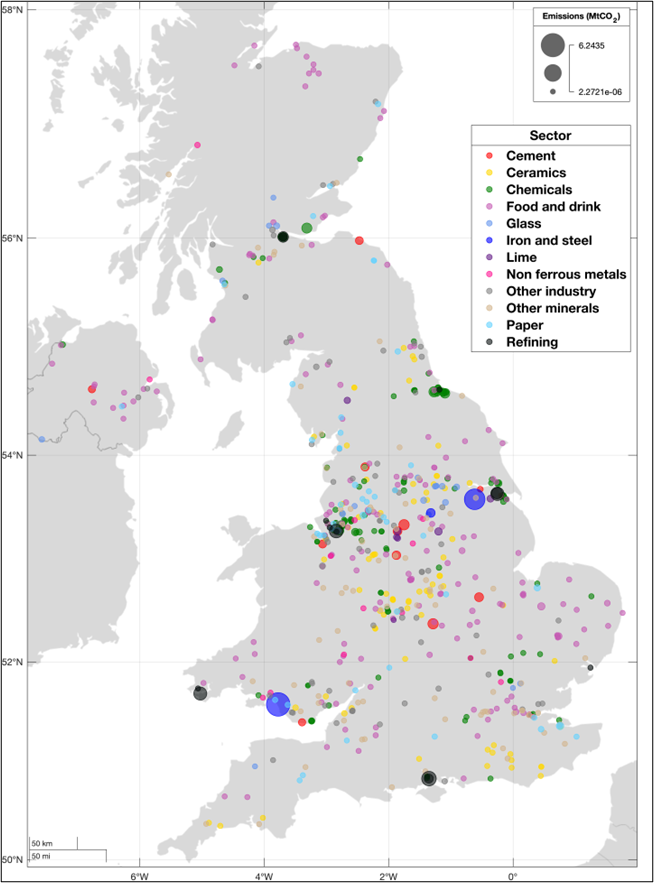
Figure 2 Location of UK industrial point source sites based on the NAEI 2020 data.
Figure 3 compares the sectoral emissions of the NAEI 2017 and NAEI 2020 data. It shows that most sectoral emissions have reduced in 2020 compared to 2017 except for food and drink, and paper sites. This emissions reduction may be attributed to reduced manufacturing activity during the COVID-19 pandemic. Food and drink show a slight increase in the total number of sites in the NAEI data for 2020 compared to 2017 which may explain the emissions increase. Although paper production is expected to decrease due to increased use of digital media by end users, there is significant UK demand for corrugated cardboard (that is used, for instance, in Amazon packaging) which may explain the slight rise in emissions for this sector.
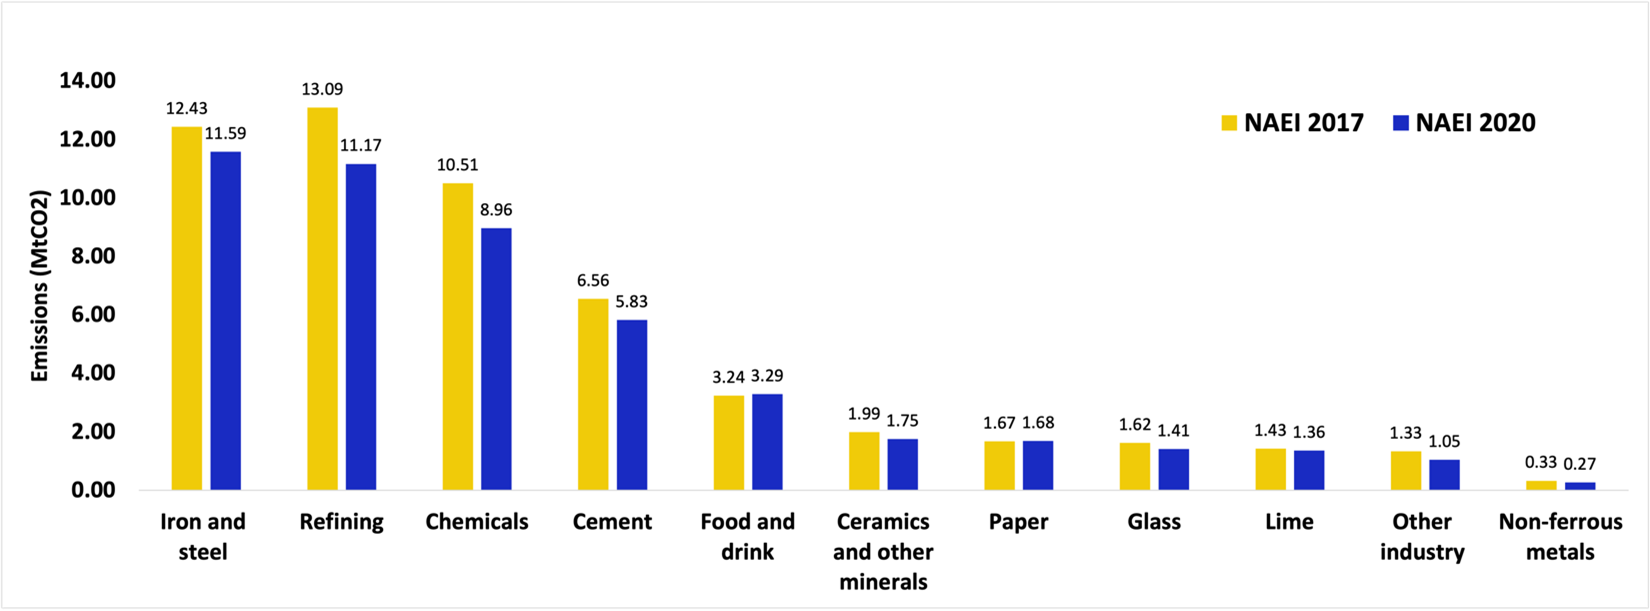
Figure 3 Comparison of sectoral point sources emission data in 2017 and 2020. The NAEI 2017 data is based on the data reported in CCC, 2020. Deep-Decarbonisation Pathways for UK Industry.
Although emissions from UK manufacturing industry have decreased by nearly 6 MtCO2 in 2020 compared to 2017, there is a need to account for non-point sources sites emissions to get the full picture (which we did not analyse yet). The emissions reductions identified may also be temporary due to COVID-19 production halt. Therefore, continued decarbonisation efforts are needed to reach net zero by 2050.